Why Training Intensity Tracking Matters for Youth Sports Clubs
Meta Description: Tracking training intensity and athlete fatigue helps coaches plan smarter sessions, reduce injury risk, and keep players performing at their best across a long season.
Date of creation: 2026-06-16
Industry Focus: Football • Basketball • Volleyball • Multi-sport clubs
Compliance Scope: Athlete welfare • Periodisation • Load management
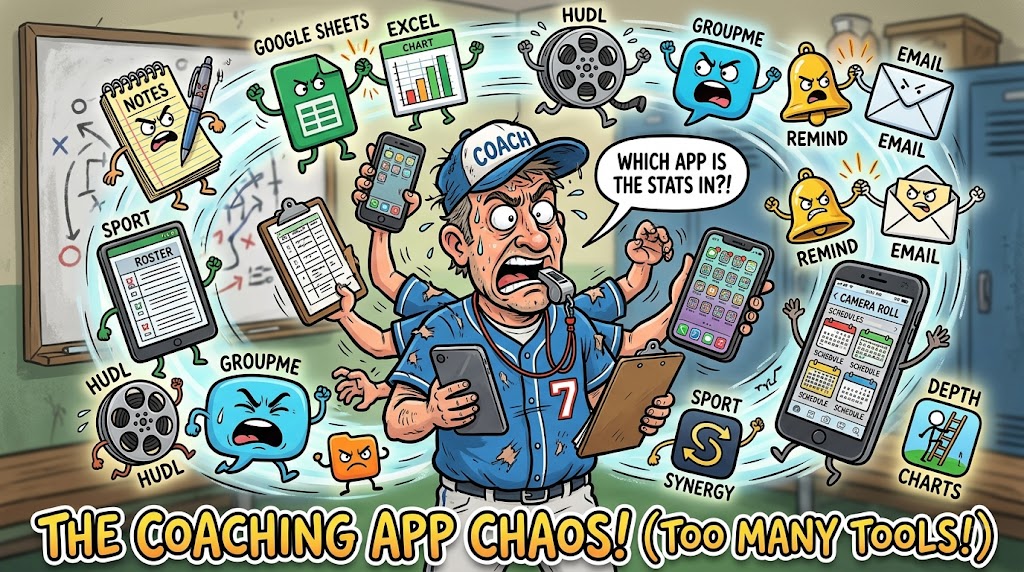
The Problem Coaches Actually Face
Most clubs track attendance well. Few track load.
A coach runs three sessions per week, rotates the squad, and still hears the same complaints mid-season: tired legs, recurring niggles, and players underperforming in matches after heavy training weeks. Without structured intensity data, decisions become guesswork.
Was Tuesday's session too hard? Did the U17 group accumulate too many high-intensity minutes this month? Did a returning player get thrown back into a full session too soon?
These are operational questions — and they deserve operational answers.
What Intensity Tracking Adds
Intensity tracking records how hard each training was for each athlete: duration, perceived load (low / medium / high), and trends over time.
When paired with attendance and performance analytics, it gives coaches a complete picture:
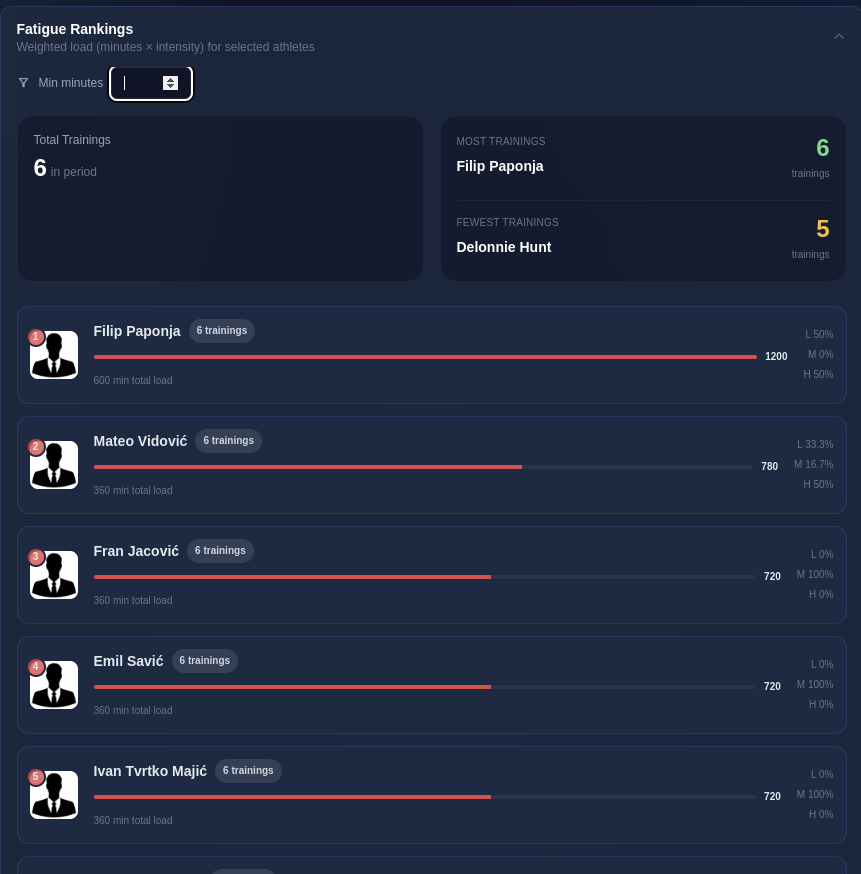
- Fatigue rankings — who is carrying the highest cumulative load
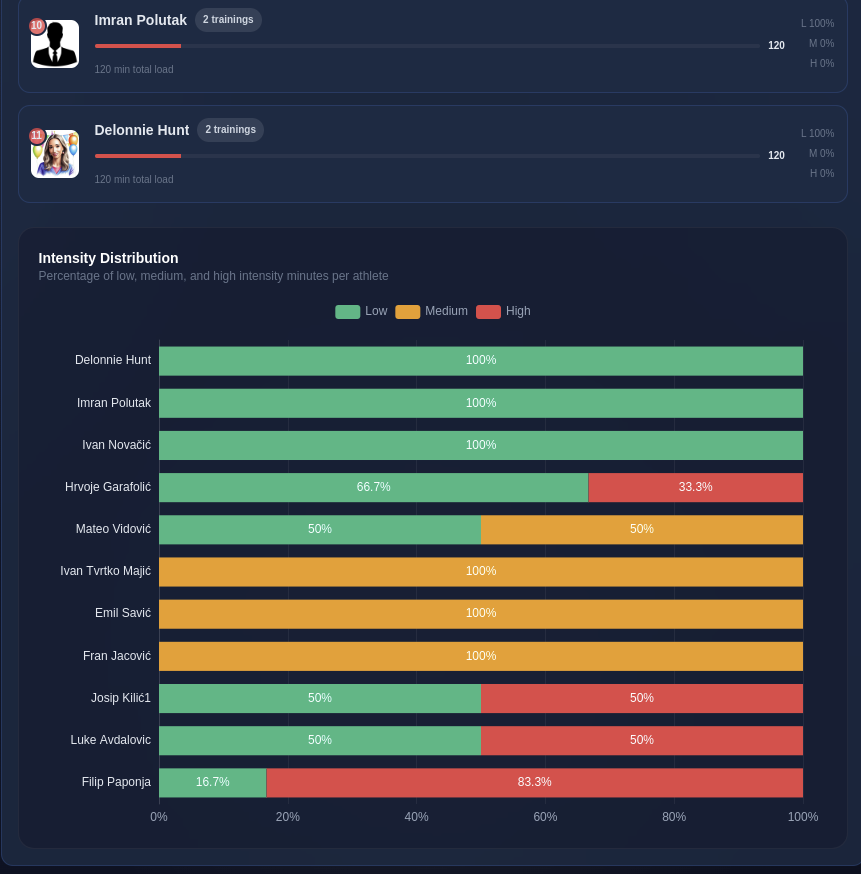
- Distribution charts — percentage of low, medium, and high minutes per athlete
- Threshold filters — flag athletes above a safe minute count
Instead of reacting to injuries, clubs can manage load proactively.
How to Implement It Without Extra Admin
The biggest barrier to load tracking is friction. If logging intensity adds ten minutes after every session, coaches won't do it.
A practical workflow looks like this:
- Set a default session duration when creating training (e.g. 60 minutes)
- Adjust per athlete only when someone left early or trained separately
- Use a simple 1–3 intensity scale (low / medium / high) on a slider
- Review fatigue analytics weekly before planning the next block
The data compounds quickly. After four weeks, patterns emerge that no spreadsheet can replicate.
What to Look For in Analytics
When reviewing fatigue data, focus on three signals:
1. Cumulative load spikes
A player whose weighted load jumps 40% week-over-week is a yellow flag — especially during congested fixture periods.
2. High-intensity concentration
If more than 50% of an athlete's minutes are logged as high intensity across multiple sessions, consider a recovery-focused week.
3. Asymmetry across the squad
Large gaps between the most and least loaded players may indicate selection bias, incomplete logging, or athletes avoiding full participation.
Conclusion
Intensity tracking is not about replacing coaching intuition. It is about giving intuition better inputs.
Clubs that log load consistently make safer return-to-play decisions, plan fresher match weeks, and have clearer conversations with players and parents about why certain sessions are structured the way they are.
Explore ClubMeter training tracker
References
- Soligard T. et al., International Olympic Committee consensus statement on load in sport, British Journal of Sports Medicine, 2016
- Gabbett T.J., The training-injury prevention paradox, British Journal of Sports Medicine, 2016
- UEFA Medical Committee, Load management guidelines for youth football, 2023